COVID-19 & Facemasks (A Sentiment Analysis)
Authors: Will Henderson, Dr. Anastasia Thyroff, Dr. Elizabeth Barr, Dr. Johnell Brookes, Dr. Andrew Hurley

Figure 1: The volume of social media posts from the dates February 20th to May 20th. The keywords used in this analysis were “Mask” and “Masks.”
The Social Media Listening Center at Clemson University utilized the software to gather volume, sentiment and most commonly used words around the facemasks conversation.
According to the data collected from the SMLC, conversation started increasing on March 12th with clear spikes in the volume of posts on March 31st and April 3rd (Figure 1).

Figure 2: Comparison of post volume compared to other platforms across the 90 day window
In a comparative analysis of social media volume (figure 2), the research gathered 50.5 million tweets compared to the 2.6 million YouTube comments and videos. Through all of posts gathered, the SMLC analyzed 55 million posts regarding masks.
 Figure 3: List of Twitter accounts who have the most influence in the conversation. Each account is given a score between 1-100. The score is calculated by follower-following ratio, lifetime of the account, quality of the account, and engagement with their tweets.
The influencers (figure 3) that had the largest authority during this time included CBS News (@CBSNews, The Hill (@TheHill), and Ben Shapiro (@Benshapiro). These accounts had a high influencer score that firmly impacted the conversation.

Figure 4: A word cloud is visualized through the most commonly used words in the posts. With an analysis of “masks,” the chart shows that other keywords are trending such as “trump” and “refusing.” The researchers can further analyze to see all posts with any of the displayed words.
Through the 55 million posts that were analyzed by the SMLC, a word cloud (figure 4) was visualized to identify what users are saying in conjunction with “masks.” The team noticed that the keywords “refusing” and “social distancing” are commonly used with the word mask in the public social media data. The team is able to dive deeper into the words to analyze the posts that mention each specific word in the word cloud.

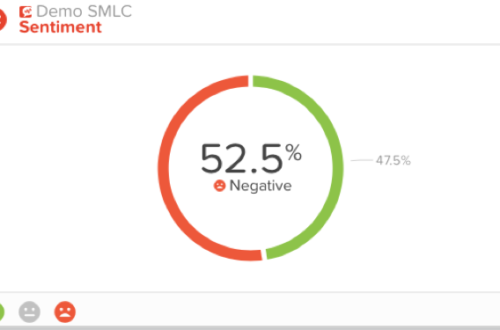
Figure 5: The sentiment around social media posts mentioning masks is split 52.5% negative compared to 47.5% positive.
Also found in the data (figure 5) , the social media posts were split 52.5% negative and 47.5% positive. The SMLC tracks the sentiment through the software with negative/positive keyword tracking. The sentiment analysis shows that while masks are a hot topic with 55 million posts, there is an equal voice on each side of the topic.

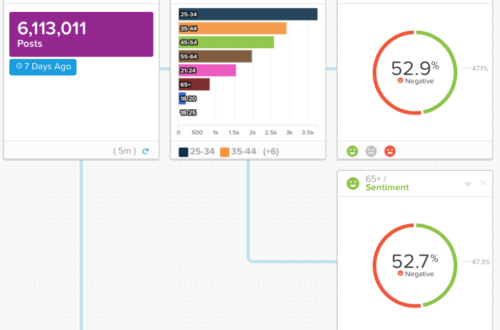
Figure 6: The 6,113,011 posts are pulled from May 13th – May 20th, 2020. The posts are then divided into age demographics. The sentiment is representative of the age groups 25-34 and 65+.
The SMLC software pulled demographic data and corresponding sentiment between 25-34 and 65+. While it was equally shared on the sentiment analysis, the data does showcase that 25-34 year olds are the most active age demographic on social media regarding this topic. The least active audience is 18-20 years olds with under 250 posts during that timeframe.
Figure 7: Sentiment is analyzed on all social media platforms from May 20th – May 27th.
Along with the demographic sentiment, the SMLC analyzed each platform content to determine the volume of positive/negative posts. With Reddit and Instagram leading with the highest percentage of negative posts, Facebook led with positive social media posts. The SMLC software does recognize reviews on websites. The data included in that column is from reviews left on JoannFabrics.com and Ipsy.com.

