The News in New Media

It’s (Not) Quiet Uptown – Hamilton & Disney+

It’s (Not) Quiet Uptown

As a historic tribute to the country on a very patriotic weekend, Hamilton was released on Friday, July 3, kicking off the Fourth of July weekend.

The Social Media Listening Center monitored discussion of the musical on social media platforms from June 25 until July 9 to see who would take their shot discussing Hamilton.
In that time period, there were 2.7 million total posts, 92.2% of which came from Twitter. Other notable platforms that mentioned Hamilton included YouTube (5.7%), Facebook (2%), and Mainstream news (.3%).

The musical was mainly talked about in the United States but was also mentioned in the United Kingdom, Canada and Brazil. These top countries predicted the top languages: English, Spanish, Portuguese and French.


Discussion of Hamilton spiked the most on the day it was released with 659, 231 total tweets. However, there was also a small spike on June 28th, the day that marked the one-week countdown until the musical was released. After Hamilton was released on July 3, there has been a steady decline of discussion on the musical, most likely because as people watch it, excitement has dwindled.

Despite the steady decline, sentiment has remained positive. The 65.8% positive rate included enthusiasm of either awaiting the release or finally be able to watch the musical. Negative sentiment came in at around 34.2% where people discussed their cynical view of the play on social media.


But, for the time being, the musical is set to stay on Disney+, so before you have to wait for it, meet a friend inside and give yourself a musical taste of American History. You can’t help but be satisfied!

FULL ANALYSIS: 
Total Posts

  • 2.7m total posts mainly stemming from Twitter (92.2%)
    • Other popular platforms were YouTube and Forum replies
      • Facebook trended at .2% and Mainstream News at .3% 

Influencers

  • Top 3 Influencers
    • @bbcturkce
    • @BBCSport
    • @CNN

 Top Places  

  • 5% United States
  • 7% United Kingdom
  • 4% Canada
  • 3% Brazil

Top Languages   

  • 8% English
  • 3% Spanish
  • 6% Portuguese
  • 4% French

 Media Trend Type

  • Chatter spiked on July 3rd, the day Hamilton was released on Disney+
    • July 3rd there were 659,231 total tweets
    • There was a small spike on June 28th talking about viewing parties, people singing along to the musical and excitement about being exactly a week away
  • After the release, there was a slight decline until the 9th as excitement settled and people watched the musical

Sentiment Rate

  • 34.2% Negative Sentiment rate
    • Mainly people not liking the musical saying it was bad, awful or had a poor storyline
    • Others stated they would never watch the musical no matter what happened
  • 65.8% Positive Sentiment rate
    • People saying Hamilton is a fantastic musical that includes a lot of history and knowledge
      • Positive feedback from critics, reviewers and ‘normal’ people on social media
    • Funny posts of Hamilton cast personalities and them interacting with TV personalities like Jimmy Jallon

 Total Posts on Instagram

  • 91,838 Total Posts using the hashtag #hamiltonthemusical
  • Majority of posts highlight Hamilton memes, actors and actresses and scenes from the play


Facemasks Analysis : A Social Listening Summary

Over the past week, many states have hit the brakes on opening up as COVID-19 cases have spiked.

As of June 25, 18 states and an increasing number of cities and towns have implemented laws that required face masks in public. Most recent states requiring facemasks include: North Carolina, Nevada and Washington. More locally, towns like Greenville, Charleston, Columbia and Clemson have mandated facemasks after Gov. Henry McMaster said he will not require masks to be worn in public in South Carolina.

There has been an uproar on social media regarding facemasks with a 52.1% negative sentiment rate consisting of posts trying to shame people into wearing masks in public and a debate on if masks are actually beneficial to your health.

There are also many complaints that masks are uncomfortable and restrict oxygen levels. The other 47.9% positively reflect how masks can affect your health. Other posts regarding positive sentiment include different fabric styles and different companies responding to the mask requirement.


Masks are most talked about in the United States (68.2%), India (4.7%) and the United Kingdom (3.5%), where COVID-19 cases, and deaths, are currently the highest. Languages that are currently discussing masks are English (67.4%), Spanish (16%), and French (2.4%).


There is no real peak to the mask trend on social media as posts have stayed varied and consistent. However, there is a depression in the graph that matches up to when states began to phase open up and masks were no longer required. The trend spikes back up when COVID-19 cases also rose. Top three words include #covid19, masks and wear.

Overall the talk about masks amounted to a total 37 million posts, of which 94.4% came from Twitter. About 2 million posts using the hashtag, #masks, came from Instagram and there are many groups on Facebook specifically for selling and making masks. Debate on comfort of mask aside, mask up and stay safe out there, masks are shown to stop the spread of COVID-19 by up to 70%.


COVID-19 & Facemasks (A Sentiment Analysis)

COVID-19 & Facemasks (A Sentiment Analysis)

Authors: Will Henderson, Dr. Anastasia Thyroff, Dr. Elizabeth Barr, Dr. Johnell Brookes, Dr. Andrew Hurley

Figure 1: The volume of social media posts from the dates February 20th to May 20th. The keywords used in this analysis were “Mask” and “Masks.”


The Social Media Listening Center at Clemson University utilized the software to gather volume, sentiment and most commonly used words around the facemasks conversation.

According to the data collected from the SMLC, conversation started increasing on March 12th with clear spikes in the volume of posts on March 31st and April 3rd (Figure 1).


Figure 2: Comparison of post volume compared to other platforms across the 90 day window

In a comparative analysis of social media volume (figure 2), the research gathered 50.5 million tweets compared to the 2.6 million YouTube comments and videos. Through all of posts gathered, the SMLC analyzed 55 million posts regarding masks.


Figure 3: List of Twitter accounts who have the most influence in the conversation. Each account is given a score between 1-100. The score is calculated by follower-following ratio, lifetime of the account, quality of the account, and engagement with their tweets.

The influencers (figure 3) that had the largest authority during this time included CBS News (@CBSNews, The Hill (@TheHill), and Ben Shapiro (@Benshapiro). These accounts had a high influencer score that firmly impacted the conversation.


Figure 4: A word cloud is visualized through the most commonly used words in the posts. With an analysis of  “masks,” the chart shows that other keywords are trending such as “trump” and “refusing.” The researchers can further analyze to see all posts with any of the displayed words. 


Through the 55 million posts that were analyzed by the SMLC, a word cloud (figure 4) was visualized to identify what users are saying in conjunction with “masks.” The team noticed that the keywords “refusing” and “social distancing” are commonly used with the word mask in the public social media data. The team is able to dive deeper into the words to analyze the posts that mention each specific word in the word cloud.


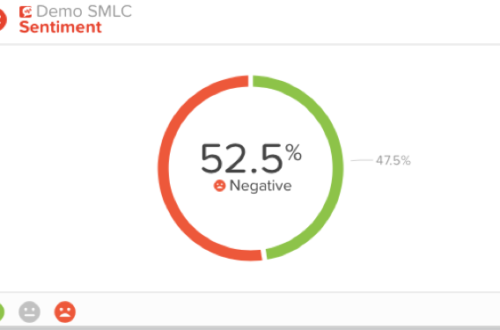
Figure 5: The sentiment around social media posts mentioning masks is split 52.5% negative compared to 47.5% positive.

Also found in the data (figure 5) , the social media posts were split 52.5% negative and 47.5% positive. The SMLC tracks the sentiment through the software with negative/positive keyword tracking. The sentiment analysis shows that while masks are a hot topic with 55 million posts, there is an equal voice on each side of the topic.


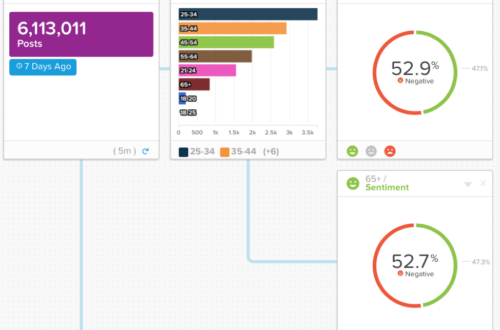
Figure 6: The 6,113,011 posts are pulled from May 13th – May 20th, 2020. The posts are then divided into age demographics. The sentiment is representative of the age groups 25-34 and 65+.

The SMLC software pulled demographic data and corresponding sentiment between 25-34 and 65+. While it was equally shared on the sentiment analysis, the data does showcase that 25-34 year olds are the most active age demographic on social media regarding this topic. The least active audience is 18-20 years olds with under 250 posts during that timeframe.


Figure 7:  Sentiment is analyzed on all social media platforms from May 20th – May 27th.


Along with the demographic sentiment, the SMLC analyzed each platform content to determine the volume of positive/negative posts.  With Reddit and Instagram leading with the highest percentage of negative posts, Facebook led with positive social media posts. The SMLC software does recognize reviews on websites. The data included in that column is from reviews left on JoannFabrics.com and Ipsy.com.